Two weeks, six majors, $715M in Binance perp liquidations
Binance perpetual futures liquidations across BTC, ETH, SOL, BNB, XRP, DOGE over two weeks. Shorts financed 59% of the $715M wrecked. ETH printed the biggest single-minute cascades. DOGE was the only asset where longs paid more than shorts. Cross-exchange feeds: 24h preview.
Between April 25 and May 12, our cross-exchange liquidations daemon recorded 30,775 forced-close events on Binance perpetual futures across six majors. The aggregate notional that got wiped: ~$715M. Of that, $293M was longs and $422M was shorts. Shorts paid 59% of the bill over a window where BTC moved from ~$77.5K to ~$80.7K and ETH oscillated in a 5% box.
This is the companion piece to shorts paid for the rally. Funding tells you who is paying to be in the wrong direction; liquidations tell you when they get carried out of the building.
Coverage gap of four days (Apr 28 to May 1) due to daemon downtime. The window spans 18 calendar days, of which we have data on 14 for BTC/SOL, 13 for ETH/XRP, and 12 for BNB/DOGE. Activity ramps from May 3: Apr 25–27 are quiet pre-rally days with single-digit-millions of liquidations each. Roughly one forced-close event every thirty seconds across the six assets during active hours.
The split by asset
| Asset | Total liquidated | Long $ | Short $ | Long% | Short% | Events |
|---|---|---|---|---|---|---|
| BTC | $330.4M | $114.5M | $216.0M | 34.6% | 65.4% | 9,846 |
| ETH | $274.6M | $136.5M | $138.2M | 49.7% | 50.3% | 8,276 |
| SOL | $62.6M | $18.5M | $44.2M | 29.5% | 70.5% | 5,292 |
| BNB | $6.9M | $2.0M | $4.9M | 28.6% | 71.4% | 1,439 |
| XRP | $16.4M | $8.1M | $8.3M | 49.2% | 50.8% | 3,234 |
| DOGE | $24.2M | $13.7M | $10.5M | 56.5% | 43.5% | 2,688 |
BTC, SOL, and BNB are firmly short-heavy: two-thirds-plus of the dollar damage landed on shorts. These are the three assets that printed the cleanest local highs in the window. ETH and XRP came out roughly balanced. ETH spent the period mean-reverting with two violent one-sided cascades pointing opposite directions that cancel out in aggregate. DOGE is the outlier, the only asset where longs paid more.
BTC daily liquidations
The clearest read on the structure is the day-by-day BTC split, with shorts above the line and longs below.
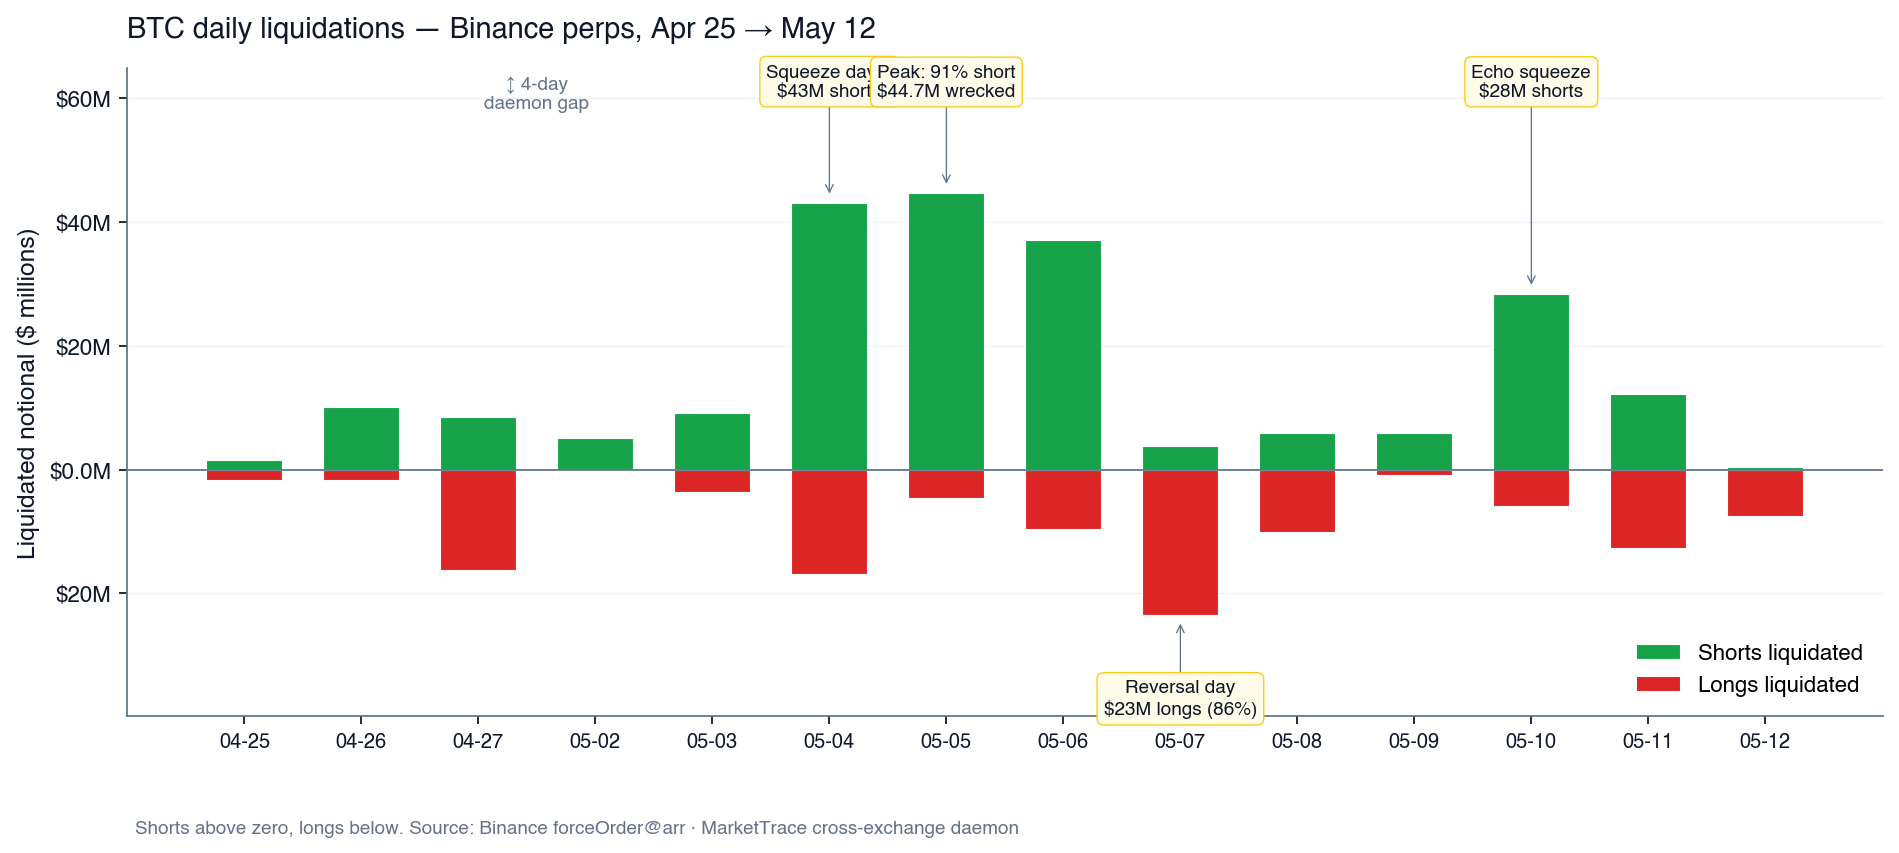
Three consecutive days of shorts paying (May 4–6, $125M wrecked on BTC alone, price up $2.1K), a single-day reversal that ate $23M of longs (May 7), and a second short squeeze five days later (May 10, $28M). The asymmetry tracks direction: on each of the 9 days where BTC moved ≥ 0.5%, the side opposite to the move paid the majority of the bill. Probability under a fair coin: 1/512 ≈ 0.2%.
Anatomy of the cascade days
Top 60-second windows by aggregate liquidation notional, across all six assets:
| # | Asset | Notional | Events | Duration | Side | UTC |
|---|---|---|---|---|---|---|
| 1 | ETH | $14.3M | 24 | 128s | 100% short | 2026-05-04 01:59:21 |
| 2 | ETH | $14.0M | 40 | 164s | 100% long | 2026-05-07 14:35:57 |
| 3 | BTC | $10.6M | 12 | 59s | 100% short | 2026-05-05 05:38:49 |
| 4 | BTC | $10.0M | 43 | 197s | 100% short | 2026-05-05 21:01:08 |
| 5 | ETH | $9.5M | 40 | 105s | 100% short | 2026-05-02 21:36:40 |
| 6 | ETH | $9.0M | 28 | 146s | 100% short | 2026-05-10 15:44:48 |
| 7 | ETH | $7.6M | 117 | 539s | 99% long | 2026-05-04 10:02:06 |
| 8 | BTC | $6.7M | 28 | 122s | 1% long | 2026-05-04 01:59:20 |
| 9 | BTC | $6.6M | 7 | 49s | 100% short | 2026-05-10 23:02:10 |
| 10 | ETH | $6.5M | 51 | 202s | 99% long | 2026-05-10 20:48:06 |
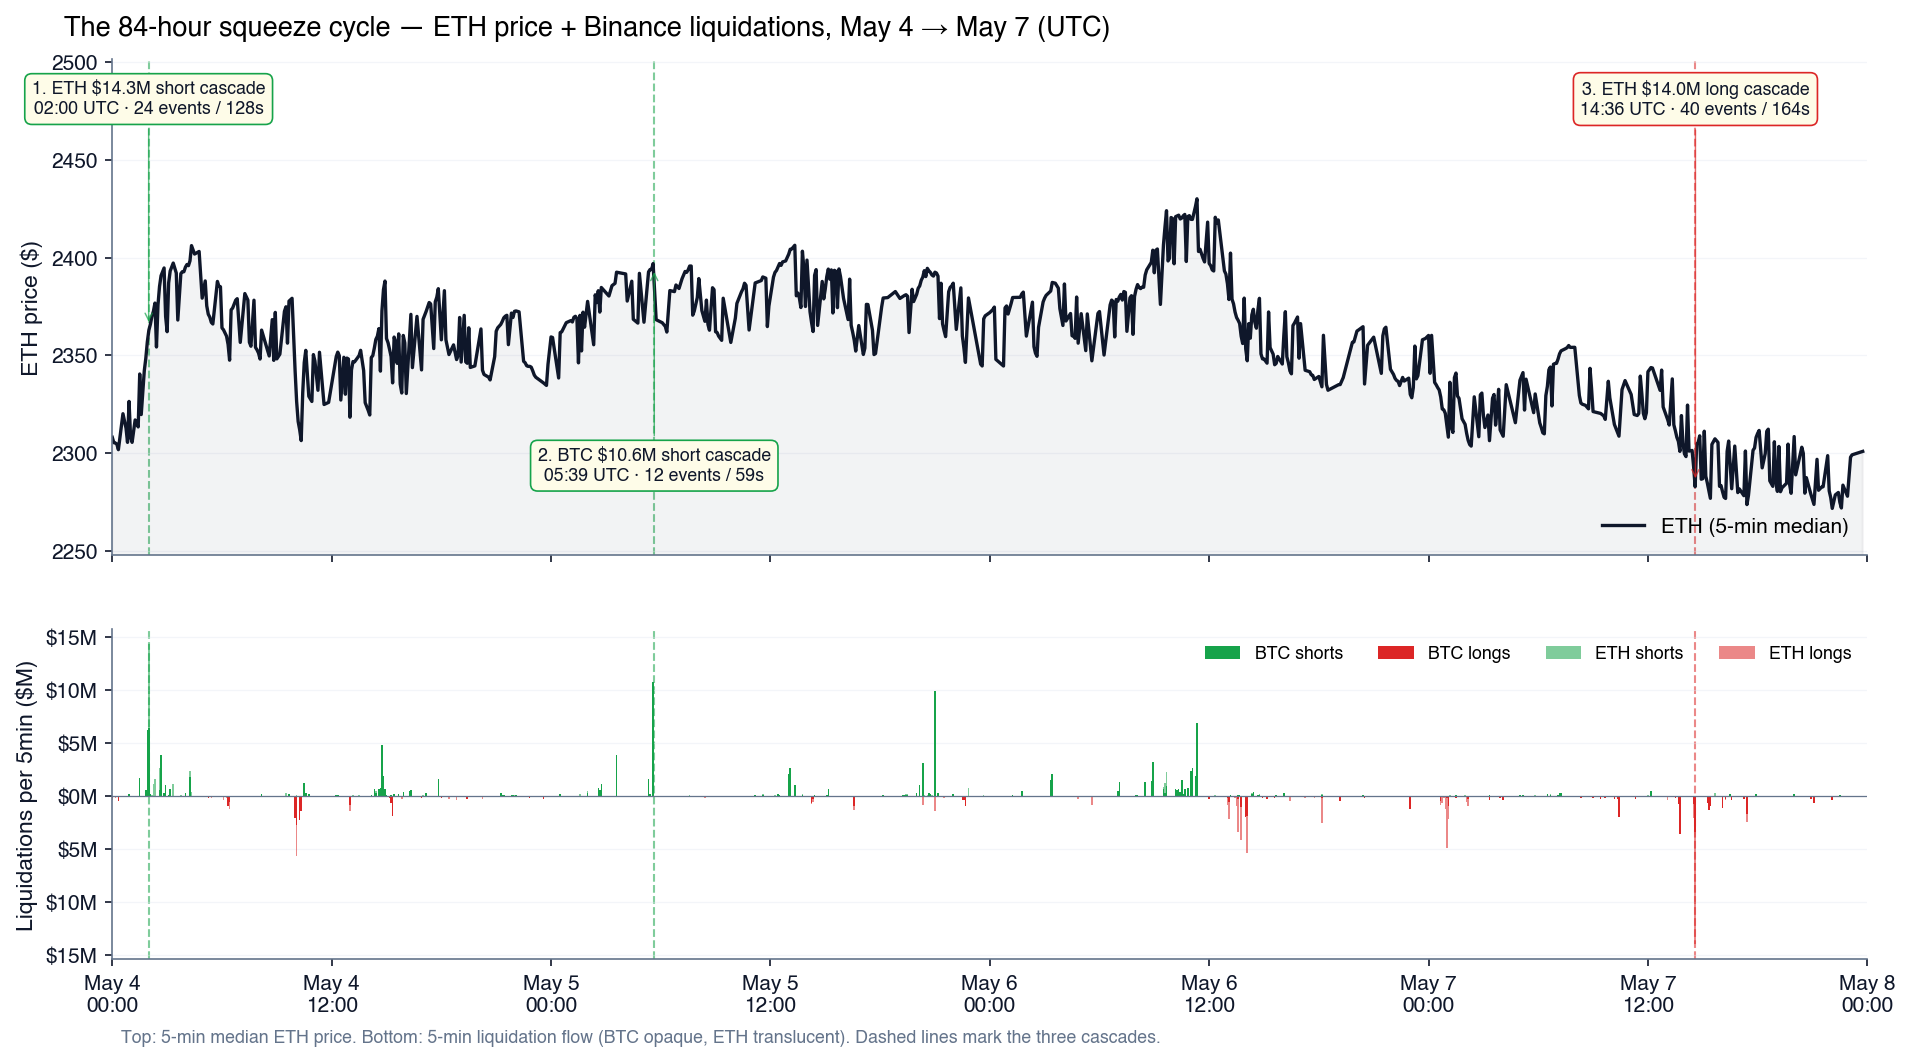
The two bookends of the squeeze cycle landed 90 seconds apart in clock-time on different days. An ETH short-cascade at 02:00 UTC on May 4 starts the rally; an ETH long-cascade at 14:35 UTC on May 7 ends it. Same asset, same playbook, opposite sides.
DOGE: the only asset where longs paid more
DOGE has averaged +0.60% funding for months. Longs literally pay shorts every 8 hours for the right to hold the position. Over our window, the DOGE long/short ratio sat at 2.59 (compare BTC at ~1.1). That book is permanently long, permanently paying to be there.
The combination is exactly what flushes out on volatility: over-positioned in one direction, paying to stay there. Over ten active days, longs were the majority of every cascade ticket that mattered on DOGE. The single largest DOGE liquidation in the window, a $732K long, fired in the same 20:49 UTC minute as the single largest XRP long ticket on May 10. A small but unmistakable cross-asset retail-long flush.
If you held DOGE perp during this window, you were statistically the most likely retail name to be wiped. Not because DOGE moved hardest (the price barely moved at all), but because the book was structurally lopsided and the funding was bleeding longs into every quiet hour. Price charts don't show this. The liquidation flow does.
The single biggest events
| Asset | Notional | Side | Price | Qty | When |
|---|---|---|---|---|---|
| ETH | $11.86M | short | $2,378.95 | 4,983 ETH | 2026-05-04 02:00:25 UTC |
| ETH | $10.43M | long | $2,272.63 | 4,588 ETH | 2026-05-07 14:38:12 UTC |
| BTC | $9.19M | short | $81,878 | 112.25 BTC | 2026-05-05 05:39:26 UTC |
| BTC | $5.40M | short | $82,905 | 65.08 BTC | 2026-05-10 23:02:12 UTC |
| SOL | $1.01M | short | $87.50 | 11,500 SOL | 2026-04-26 18:15:22 UTC |
| DOGE | $0.73M | long | $0.106 | 6.93M DOGE | 2026-05-10 20:49:27 UTC |
| BNB | $0.39M | long | $616.10 | 638.81 BNB | 2026-05-04 10:21:56 UTC |
| XRP | $0.39M | long | $1.426 | 270,900 XRP | 2026-05-10 20:49:27 UTC |
The two ETH tickets above $10M are the heads of the two cascades from the table above. The May 10 cross-asset minute (20:49 UTC) carries both DOGE and XRP's largest long tickets of the window. Retail longs got rinsed on alts that otherwise barely moved.
When liquidations cluster
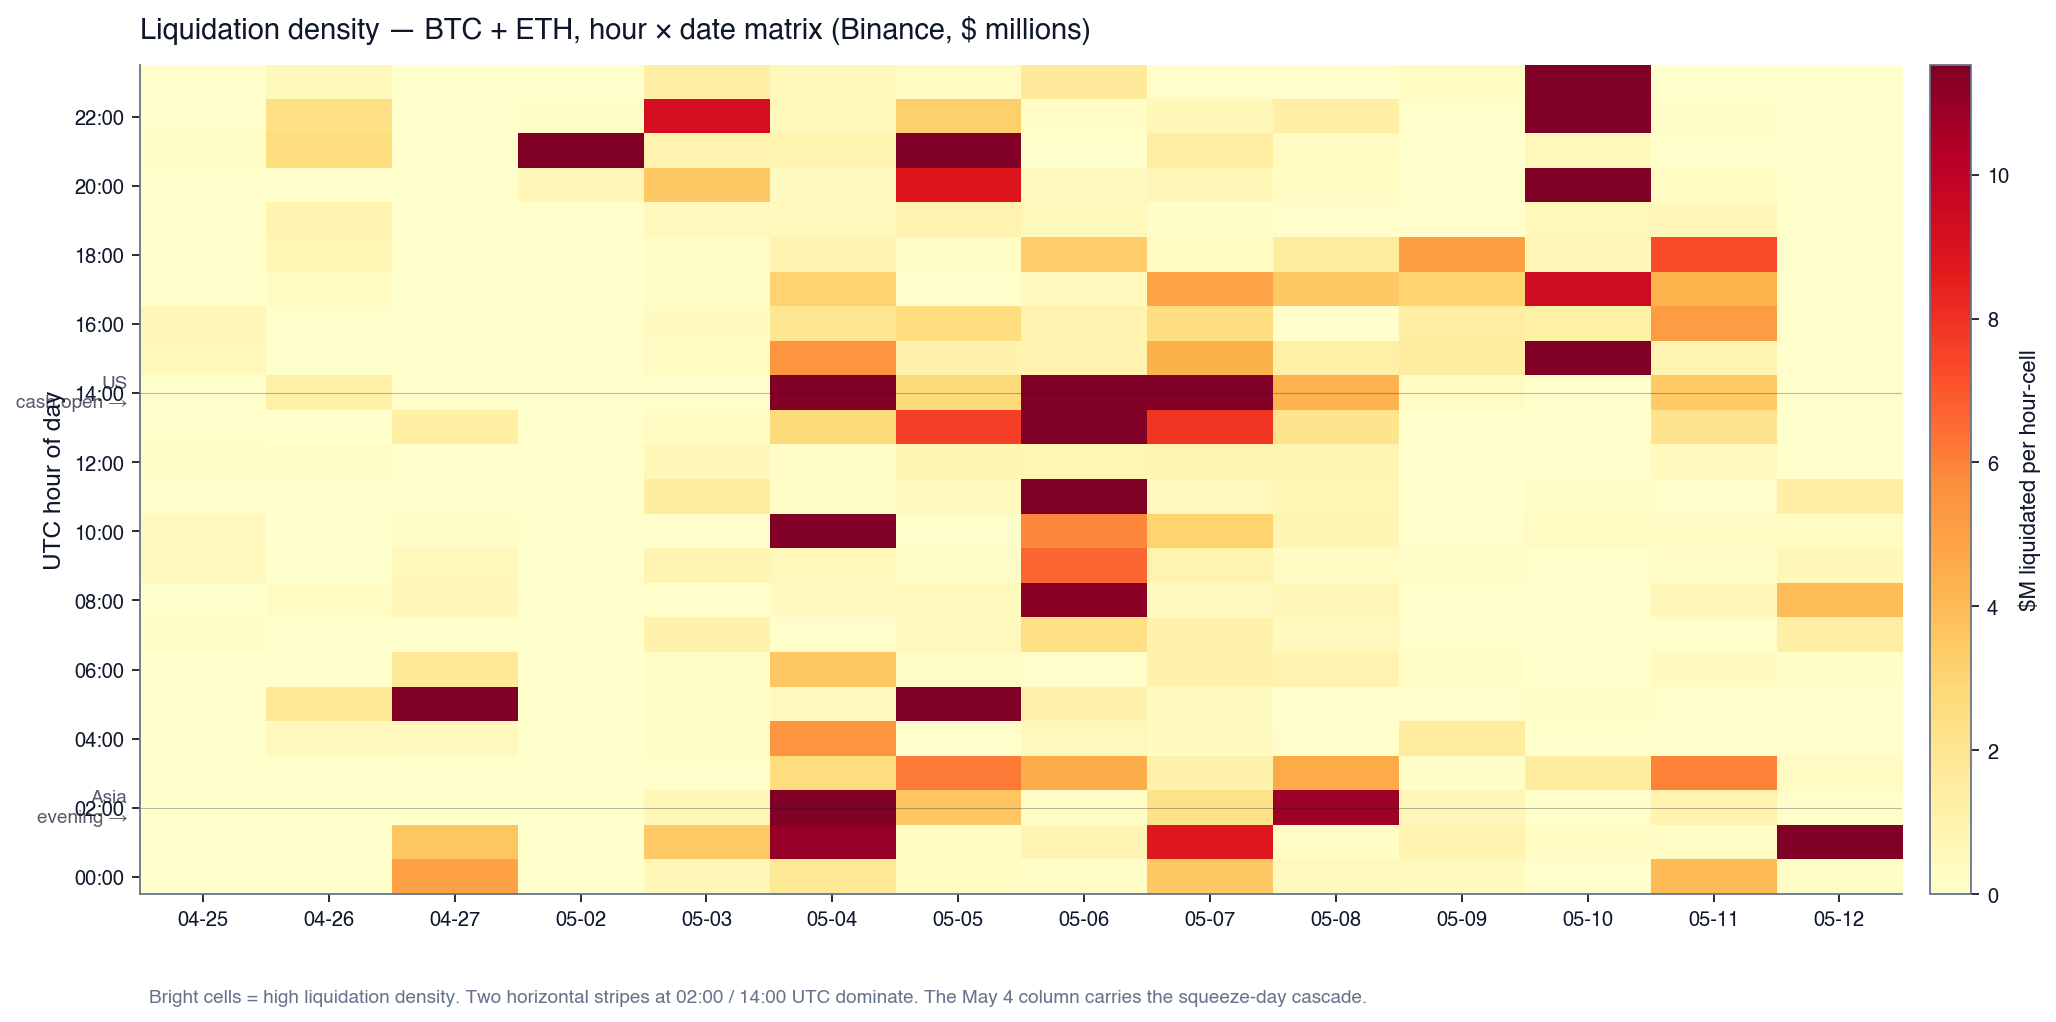
Two horizontal stripes dominate the heatmap: 02:00 UTC (Asia late evening / Europe overnight) and 14:00 UTC (US cash-equities open). Both peaks contain a cascade from the May 4–7 cycle, so the result is partially driven by those three events. On a quieter sample window these stripes would be softer.
Cross-exchange: 24-hour preview
Bybit and OKX liquidation daemons came online on 2026-05-12, so this is the first 24 hours of multi-venue data. Not enough to draw structural conclusions. As a preview:
On the first 24 hours, BTC's liquidation flow split 66/28/7 across Binance / Bybit / OKX, while every other asset concentrated 90%+ on Binance. BNB at 94% Binance, ETH at 93%. BTC perpetual liquidity is genuinely cross-venue; the alts are not.
How to watch this live
Methodology
Every liquidation event in this post comes from a private cross-exchange daemon that subscribes to the Binance !forceOrder@arr, Bybit allLiquidation (v5), and OKX liquidation-orders websocket feeds. For each fill we store ts_ms, exchange, side, qty, price, and usd = qty × price. Binance sends the liquidation order's market side (SELL closes longs, BUY closes shorts); Bybit and OKX send the position side directly. We canonicalise to long (a long got force-closed) and short (a short got force-closed) at ingest.
Storage: per-asset daily JSONL files under data/<asset>/liq_events/<exchange>/YYYY-MM-DD.jsonl, plus a 10,000-entry Redis stream per asset for the live feed. The full recorded sum for this article: $715,225,467 across 30,775 events. Sum of recorded tickets, subject to the throttle caveat above. Coverage: 14 days for BTC/SOL, 13 for ETH/XRP, 12 for BNB/DOGE, between Apr 25 and May 12 with a four-day daemon-downtime gap (Apr 28 to May 1). Cross-exchange: 367 Bybit events on May 12, 206 OKX events on May 12.
The data and pipeline are documented at methodology/liquidations.