Extreme funding rates: what 789 days of data actually show
We measured forward returns after extreme funding percentiles on BTC, ETH, SOL, BNB, XRP and DOGE: 789 days, three venues. Two popular beliefs fail the test.
Two beliefs circulate about perpetual funding, and they point in opposite directions. The first: when funding is extremely high, longs are crowded and a top is near — fade it. The second: when funding is deeply negative, shorts are crowded and a squeeze is coming — buy it.
Both sound like microstructure. Both are testable. We ran them against every hour of our cross-venue funding history — 789 days, from May 15, 2024 to July 13, 2026, across BTC, ETH, SOL, BNB, XRP and DOGE — and measured what price actually did in the next 4, 24 and 72 hours.
One belief survives, on two assets out of six. The other fails everywhere.
Every number above is a median over non-overlapping episodes, computed with as-of percentiles (no look-ahead). Method below.
How we measured it
The dataset is MarketTrace's own funding history: 2,367 samples over 789 days (2024-05-15 to 2026-07-13), aggregated across Binance, Bybit and Hyperliquid, 8h-normalized. Forward returns use Binance 1-hour closes.
"Extreme" is defined by percentile rank, not by an absolute threshold. A funding rate of 0.01% means different things in different regimes; what makes a print extreme is where it sits against the asset's own history. Each hour's rank is computed as-of that hour — using only data available at the time — so the test never grades the past with future information.
Two corrections matter, and skipping them is how most funding "studies" go wrong:
First, overlap collapse. Funding stays extreme for many consecutive hours; those hours are not independent samples. BTC spent 1,136 hours in its top funding decile, but those hours collapse into just 37 non-overlapping 72-hour episodes. All statistics are computed on the collapsed set. Quoting n = 1,136 would overstate the evidence by a factor of thirty.
Second, medians over means. Crypto forward returns have fat tails; a single squeeze can drag a mean anywhere. Medians and hit rates describe what typically happened, and the p10/p90 range describes the spread.
The engine behind these numbers is public — the same conditional outcomes endpoint ships in MarketTrace Crypto MCP, so any number in this piece can be re-derived with one call.
Belief 1: "extreme funding means a top"
The condition: funding percentile ≥ 90 against the asset's own 2-year history. The result, per asset:
| Asset | Hours matched | 72h episodes (n) | Median 72h return | Hit rate up | Median max drawdown |
|---|---|---|---|---|---|
| BTC | 1,136 | 37 | −1.18% | 40.5% | −2.91% |
| ETH | 896 | 23 | +0.95% | 56.5% | −3.82% |
| SOL | 1,032 | 33 | −0.98% | 39.4% | −5.04% |
| BNB | 1,016–1,028 | 29 | +1.10% | 55.2% | −2.61% |
| XRP | 1,360 | 32 | +1.73% | 53.1% | −3.95% |
| DOGE | 1,120 | 31 | +0.72% | 54.8% | −4.86% |
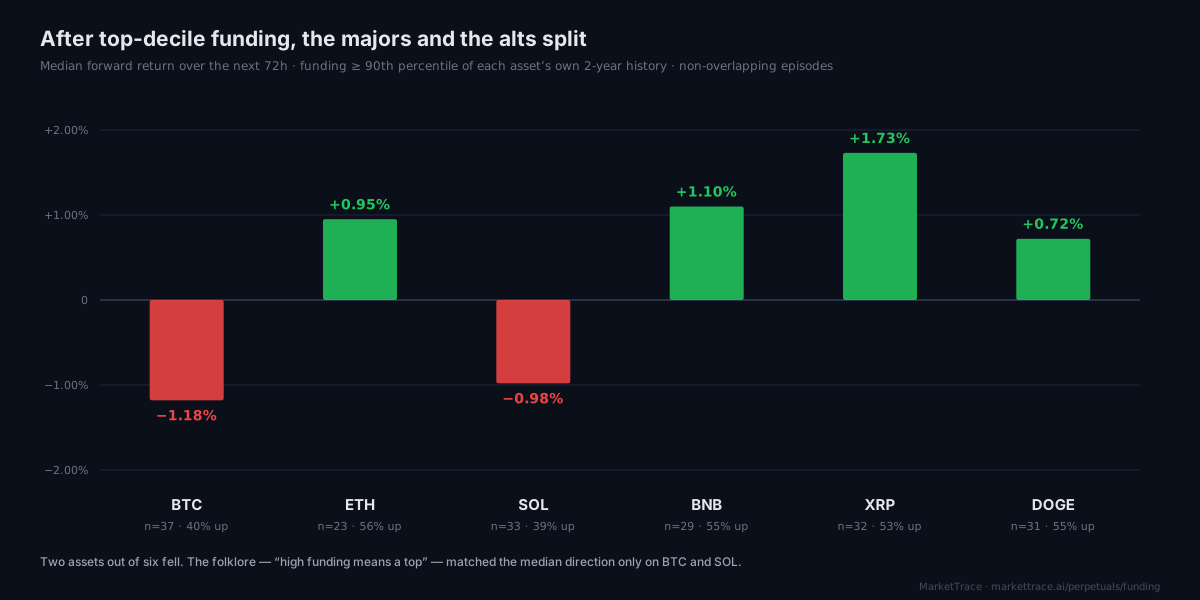
The belief holds on BTC and SOL and fails on the other four. That split is the finding.
On BTC, top-decile funding was followed by a negative median return at 72 hours and a hit rate well below chance. The classic fade logic — crowded longs paying a premium eventually become the fuel for a flush — shows up in the data. SOL behaves the same way, slightly softer.
On ETH, BNB, XRP and DOGE, the same condition resolved up more often than not. High funding on these assets read less like exhaustion and more like momentum: the crowd was paying up because the move was working, and it kept working through the measurement window. XRP is the extreme case — its p90 at 72 hours reached +26%, meaning the top decile of these "crowded" episodes ran into double-digit rallies.
Note what the table does not say. It does not say shorting BTC on high funding was a good trade — the median episode still drew down −2.9% along the way, and 40% of episodes went against the fade. It says the direction of the folklore matched the direction of the median on exactly two assets out of six, and reversed on the rest.
At shorter horizons the effect barely exists anywhere: 4-hour medians sit between −0.06% and +0.31% on all six assets. Whatever information an extreme funding print carries, it plays out over days, not hours.
Belief 2: "negative funding means a squeeze"
The condition: funding percentile ≤ 10 — the market's most short-crowded decile, where shorts pay longs and squeeze folklore says the rip is loaded.
| Asset | Hours matched | 72h episodes (n) | Median 72h return | Hit rate up | Median max drawdown |
|---|---|---|---|---|---|
| BTC | 3,568 | 111 | +0.04% | 51.4% | −2.58% |
| ETH | 3,168 | 103 | −0.10% | 48.5% | −4.29% |
| SOL | 3,152 | 103 | −0.48% | 46.6% | −4.97% |
| BNB | 1,928 | 74 | +0.21% | 52.7% | −3.28% |
| XRP | 3,528 | 120 | +0.22% | 51.7% | −3.66% |
| DOGE | 3,048 | 111 | +0.62% | 54.1% | −5.49% |
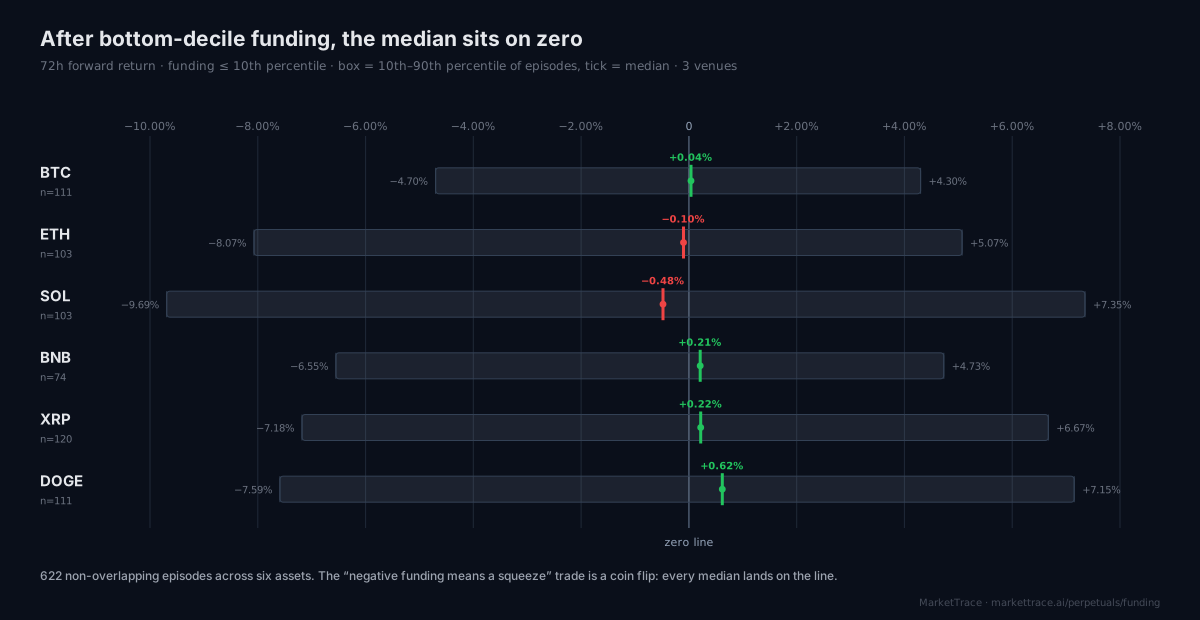
There is no squeeze premium in this table. Six assets, 622 non-overlapping episodes combined, and every median sits within ±0.7% of zero at 72 hours. Hit rates cluster around a coin flip. ETH and SOL — the two assets where a squeeze narrative gets invoked most readily — actually lean slightly negative, meaning the shorts, on median, were right.
This extends what we found in 2024–25 with two years of Binance-only data on negative funding: the sign of funding alone tells you who is paying, not where price goes next. The cross-venue, percentile-ranked version of the test says the same thing louder. Squeezes happen — we documented one paying shorts for an entire 25-day rally — but deeply negative funding did not systematically precede them.
The asymmetry between the two tables deserves a sentence. Crowded longs (belief 1) at least produced a real signal on two assets. Crowded shorts (belief 2) produced nothing anywhere. If funding extremes carry information, it lives on the long side of the market.
Why BTC behaves differently
We can offer a hypothesis, labeled as one. BTC's leverage market sits on top of the deepest spot market and the heaviest arbitrage flow in crypto. When BTC funding hits its top decile, the marginal buyer is disproportionately a leveraged one — spot demand at that scale gets routed through ETFs and desks that don't pay funding. Stretched funding on BTC therefore marks genuine positioning imbalance.
On smaller assets, a top-decile funding print happens more readily inside ordinary trend moves, and the perp market is a larger share of total flow — the crowd paying up is often the whole market, not its most reckless edge. Same indicator, different denominator.
We haven't tested that mechanism directly; the table is the claim, the paragraph is a guess at why. The honest version of this article stops at the base rates.
What this doesn't tell you
The window is one market regime: May 2024 through July 2026 — one halving cycle's aftermath, the ETF era, two macro shocks. Base rates measured here describe this sample, not a law. A different two years produced the folklore in the first place.
Medians hide tails, deliberately. The p10/p90 spread at 72 hours runs roughly ±4–9% on these conditions; individual episodes ended anywhere from −9.7% to +26.1%. A base rate is context for sizing, not a prediction for the next episode. And funding is one variable — the same engine can condition on order book skew, OI change or taker ratio; the open interest study is the first of those follow-ups.
History, not advice. MarketTrace measures what happened; what you do with a 40.5% hit rate is your business.
Check the current percentile yourself
The live funding percentile for all nine assets — the same as-of rank used in this study — is on the live funding rates, and the full conditional-outcomes engine is queryable through the MarketTrace MCP. Ask it what happened after any condition you can state; it will tell you the base rate or honestly report that history is silent.
How to cite this research
MarketTrace (2026). "Extreme funding rates: what 789 days of data actually show." Cross-venue funding percentile study, 2024-05-15 to 2026-07-13, six assets, three venues. https://markettrace.ai/blog/funding-rate-extremes — figures update quarterly; the dateModified stamp reflects the latest re-run.
Frequently asked questions
Does a high funding rate mean a top is coming?
Measured on 789 days of cross-venue data (2024–2026): only on BTC and SOL. After BTC funding reached its top decile, the median 72-hour forward return was −1.18% with a 40.5% up-rate (n = 37 episodes). On ETH, BNB, XRP and DOGE the same condition preceded positive median returns of +0.7% to +1.7%. High funding marked crowding on the majors and momentum on the alts.
Does negative funding predict a short squeeze?
Not in this sample. Across six assets and 622 non-overlapping episodes of bottom-decile funding (2024–2026), median 72-hour forward returns ranged from −0.48% to +0.62% with hit rates near 50%. Deeply negative funding identified who was paying — shorts — but carried no measurable edge on direction.
What is a funding rate percentile?
A funding percentile ranks the current funding rate against the asset's own multi-year history: the 90th percentile means funding is higher than 90% of all recorded prints for that asset. Percentiles make regimes comparable — 0.01% funding can be ordinary in a hot market and extreme in a quiet one. MarketTrace computes the rank as-of each moment, using only data available at the time.
How often is funding at an extreme?
By construction, roughly 10% of hours sit in each decile — but they cluster. BTC spent 1,136 hours in its top funding decile over 789 days, arriving in long runs that collapse into 37 distinct 72-hour episodes. Funding extremes are persistent states, not single prints, which is why counting raw hours overstates how much independent evidence exists.
MarketTrace shows aggregated funding, order flow and liquidations for BTC, ETH, SOL, BNB, XRP, DOGE, HYPE, ZEC and ENA across Binance, Bybit, OKX and Hyperliquid (liquidations cover Binance, Bybit and OKX). Informational data feed only. Not financial guidance.