VWAP trading: strategies that survive a 24/7 market
Four VWAP trading strategies adapted to 24/7 crypto perps: the pullback, the reclaim, band fades, and anchored VWAP from events. With order-flow checks.
Most VWAP guides are written for stocks. They assume an opening bell, a closing auction, and a session line that resets every morning at 9:30 New York time. Crypto perpetuals have none of that: no open, no close, no reset. Price trades through the weekend while half the guides' assumptions sleep.
This piece is about how traders actually use VWAP on perps: the pullback, the reclaim, band fades, and anchored VWAP drawn from events instead of clock boundaries. If you want the definition and the formula first, the VWAP glossary entry covers that ground. Here we assume you know what Σ(price × volume) / Σ(volume) means and care about what to do with it.
One caveat before the setups. Everything below describes how these trades are structured and what the order flow looks like when they work. It is not a recommendation to take any of them. MarketTrace publishes plumbing, not signals.
If you already know why the session line fails on perps, jump straight to the four strategies or what doesn't transfer from stocks.
Why the session line breaks on perps
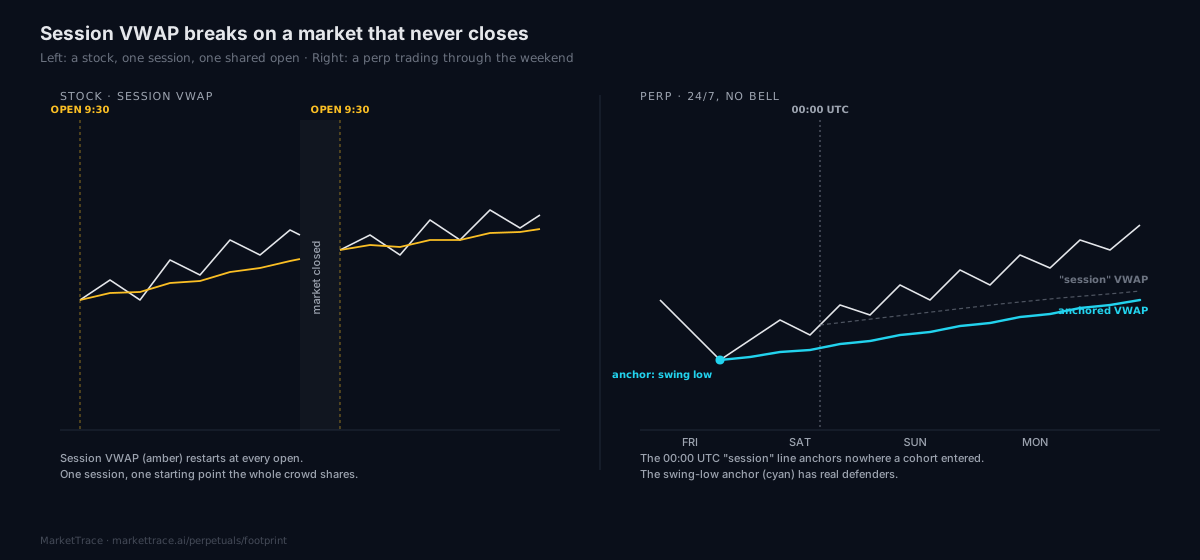
On a stock, session VWAP means something specific: the volume-weighted average price since the market opened. Every participant that day shares the same starting point. The line is the day's consensus cost basis, and desks benchmark their fills against it because the day is a natural unit of business.
On a perpetual there is no day. Charting tools still draw a "session" VWAP, but the session starts at 00:00 UTC because something has to, not because anything happens then. No auction clears. No cohort of traders enters at that timestamp. The line still averages price by volume, but the anchor is arbitrary, and an arbitrary anchor produces a level nobody is defending.
That does not make VWAP useless on crypto. It moves the weight onto one question: where do you start the calculation? That is exactly the question anchored VWAP exists to answer.
Cost basis is the whole game
Why does a volume-weighted average act as support or resistance at all? Because it tracks breakeven for a cohort of positions.
The VWAP measured from a major low is the average entry of everyone who bought since that low. While price holds above the line, that whole cohort is in profit and tends to defend it: bids appear when price comes back to their average entry, because for buyers that level is where the trade still works. Lose the line decisively and the same cohort is underwater; rallies back to it get sold by traders exiting at breakeven. The level flips.
This is also why institutions care. Execution desks slice large orders across the day in proportion to expected volume and grade themselves against VWAP: buy below it, good fill; above it, slippage. That benchmarking flow is mechanical, and it clusters around the line, which reinforces the level regardless of what any individual trader believes about it.
Two cohorts, one line. Retail defending breakeven, algos benchmarking fills. Neither needs the other to know why the level holds.
Strategy one: the pullback
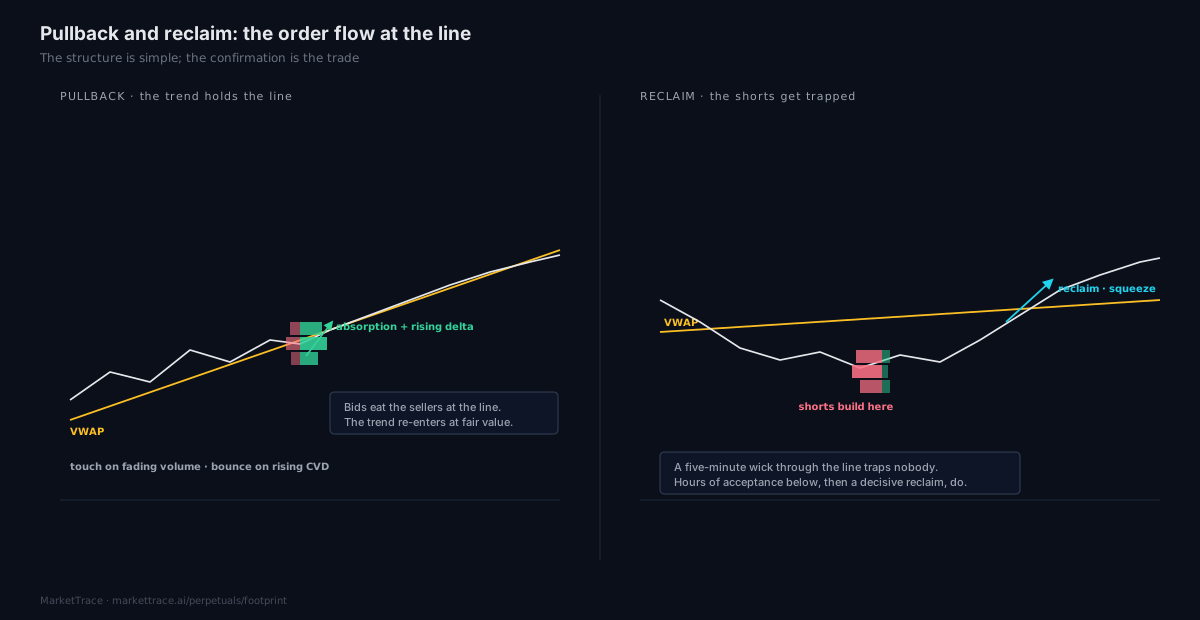
The base case. Price trends above VWAP, extends away from it, and pulls back to the line. Trend traders use the touch as a re-entry: fair value has caught up to price, and buying the retest is buying the trend at its consensus cost basis instead of chasing the extension.
The structure is simple. The work is in the confirmation, because most failed pullback trades die at a line that looked identical to the ones that held. This is where reading order flow earns its place.
The first check is absorption at the touch. On the footprint, a defended VWAP shows heavy passive buying into the dip: large bid-side volume printing at the line while price stops making progress lower. Sellers hit the level and get absorbed.
The second is delta. If CVD keeps falling while price holds the line, sellers are pressing and someone is soaking it up. If price breaks the line while CVD barely moves, the break is thin; watch for the reclaim instead.
A pullback that touches the line on declining volume and bounces on rising delta is the textbook version. A pullback that slices through on expanding sell delta is not a pullback anymore; it is the first leg of the flip described above.
Strategy two: the reclaim
The reclaim is the pullback's mirror, and on perps it fires more often, because leverage produces overshoots that stock traders rarely see.
Price loses VWAP, trades below it long enough to trap the breakout shorts, then pushes back above and holds. The shorts who sold the breakdown are now underwater with their stops overhead. The squeeze fuel is structural: their exits are buy orders.
What distinguishes a reclaim from noise is time and acceptance below the line. A five-minute wick through VWAP that snaps back traps nobody: there was no time to build short positions. A few hours of trading below the line followed by a decisive push back through it is a different event: positions were built, and they are wrong. Footprint cells below the line during the acceptance stretch show whether real short volume accumulated there or the move was empty.
The failed reclaim, where price pushes back above the line, stalls, and rolls over, is itself a setup on the short side. Same logic, inverted cohort.
Strategy three: bands, and the regime problem
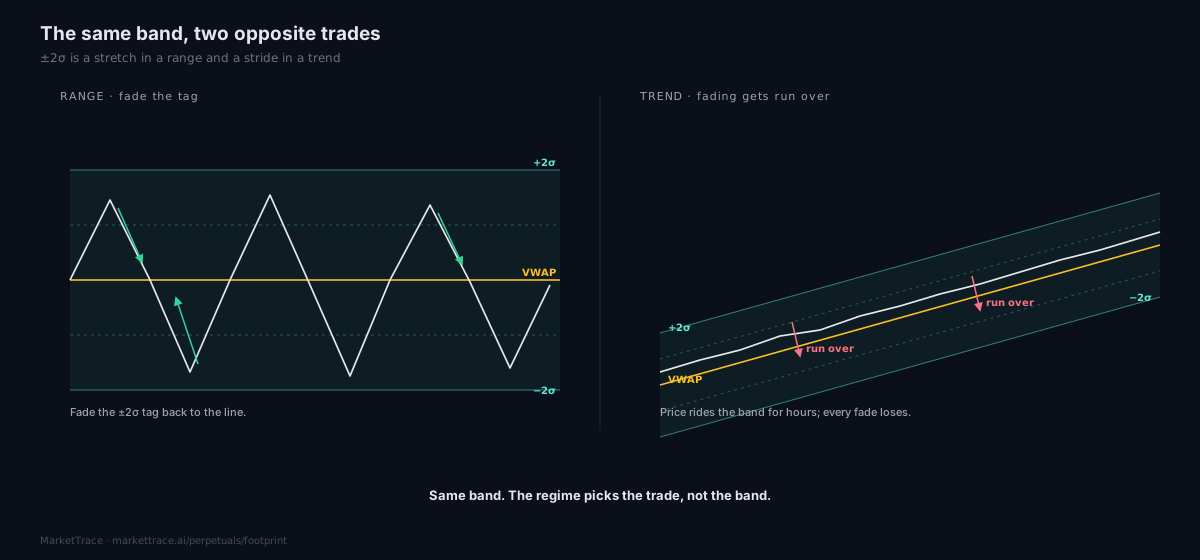
VWAP bands sit at multiples of the volume-weighted standard deviation around the line: ±1σ, ±2σ. Every bands strategy is one of two trades, and the two contradict each other.
In a range, a tag of the ±2σ band marks a stretched move, and the trade is the fade back toward the line. In a trend, price rides the +1σ band for hours and every fade loses money: persistence at the band is the signature of one-sided flow, not an overextension.
Same band, opposite trade. Which means the band itself carries no signal; the regime does. Traders who fade every ±2σ touch are implicitly betting the market stays in a range, whether they know it or not.
The honest version of this strategy spends its effort on regime identification, not band placement: realized volatility compressing, funding near its long-run median, open interest flat. And it accepts that the popular intraday band statistics were measured on equities with session resets. On a 24/7 perp with no auction to reset the distribution, those percentages do not transfer as-is. Treat the bands as a map of stretch, not a probability table.
Strategy four: anchor to what actually happened
Anchored VWAP is where the perp market's lack of sessions becomes an advantage. If no clock boundary matters, anchor to the things that do.
A liquidation cascade. When a cascade prints, the flush low is the cleanest anchor a perp offers. The AVWAP from it tracks the average entry of everyone who bought the wreckage. Cascade lows are real cohort boundaries: one mass of positions closed involuntarily, another opened into the hole. That turnover is what makes the anchor meaningful, and it is why the low of a forced move defends better than the low of a drift.
An event low. BTC broke below $60,000 on 5 June to an intraday $59,099, in what we documented as the quiet crash: a 22% unwind of an over-levered long book on no news catalyst. The AVWAP anchored at that low is the cost basis of the entire recovery. With BTC near $62,300 as of this writing, whether price holds above that line is a direct read on whether the post-crash cohort is still in profit, and still motivated to defend it.
A funding flip. When funding crosses zero after a long streak, the paying side has changed. Anchoring at the flip measures the cost basis of positions built under the new regime. Perps hand you these natural timestamps every 8 hours on the major CEXs (hourly on Hyperliquid); the flips are the ones that mark actual positioning turnover.
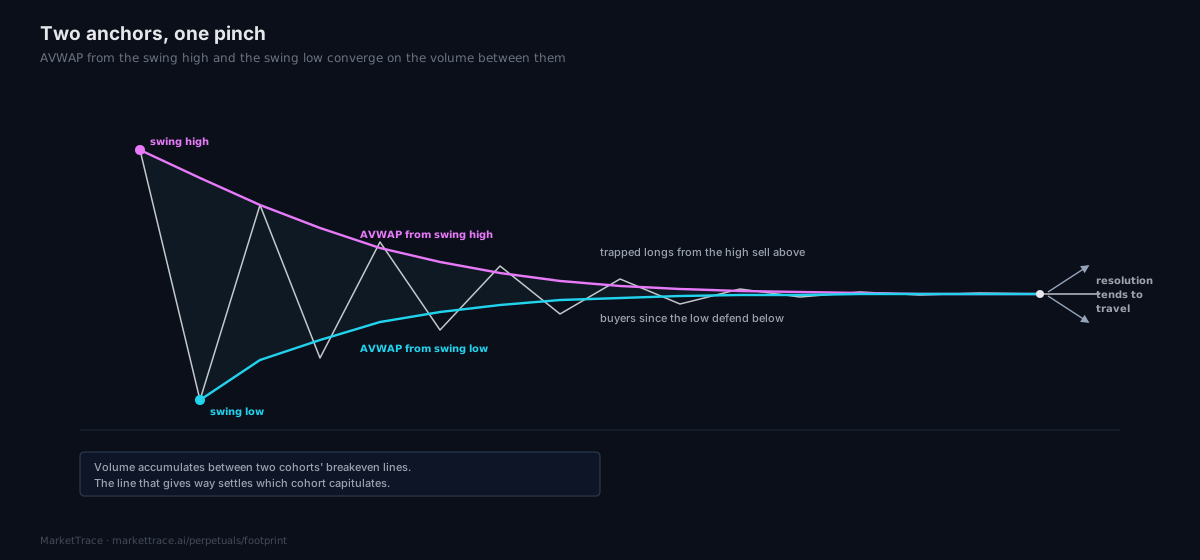
Two anchors, one pinch. The AVWAP from the last swing high and the AVWAP from the last swing low converge as volume accumulates between them. Price gets squeezed between two cohorts' breakeven lines: buyers since the low defending from below, trapped longs from the high selling from above. The resolution out of that pinch tends to travel, because it settles which cohort capitulates.
Anchor choice is the entire strategy here. An anchor at a random candle produces a random line. An anchor at an event where positions changed hands en masse produces a level with actual defenders, which is why "where did the market last reprice violently" is a better anchoring question than "where did the week start."
What doesn't transfer from stocks
Most VWAP material online is equities material with the tickers swapped. Four assumptions fail on the way over.
No opening drive. Stock VWAP strategies lean on the open, the highest-volume, highest-information window of the session. Perps have no open. The closest analogues are funding settlements, CME gaps bleeding into weekend books, and the US cash open, which still moves crypto in correlated risk regimes. We measured that during the May summit selloffs, where both BTC cascades started within eight minutes of the NYSE open.
No closing auction. There is no end-of-day benchmark flow, no market-on-close imbalance to trade against. VWAP execution on perps spreads across the whole day or targets specific liquidity windows instead.
No constant liquidity. The session-VWAP assumption of a roughly U-shaped volume day fails on weekends, when perp books thin out and a modest market order travels further. An AVWAP through a weekend carries less volume per hour of elapsed time, so the line moves slower and defends softer.
And leverage changes the failure mode. Equity VWAP breaks are usually orderly. Perp VWAP breaks can cascade, because clustered liquidation levels sit behind the line. When a defended AVWAP finally goes, check the live crypto liquidations: the break often prints as forced flow, which overshoots and then mean-reverts harder than a voluntary one.
FAQ
What is the best timeframe for VWAP trading?
VWAP isn't a timeframe indicator. It accumulates from an anchor, so the anchor matters more than the chart interval. Intraday traders typically execute on 1 to 15 minute charts while the VWAP itself runs from a session boundary or an event anchor hours or days back. The interval changes the resolution you see; the anchor changes the level itself.
Does VWAP work on crypto?
The math works identically; the convention breaks. Crypto has no session open, so a "session" VWAP anchored at 00:00 UTC is measuring from an arbitrary point no cohort of traders shares. VWAP works on crypto when the anchor is chosen deliberately (a swing low, a liquidation cascade, a funding flip), which is why anchored VWAP is the standard form on perps.
What is the difference between VWAP and a moving average?
A moving average weights every bar equally and drops old bars as it rolls forward. VWAP weights each price by the volume that traded there and accumulates from a fixed start, so heavy-volume levels pull it harder and it never forgets its anchor. The moving average answers "where has price been lately"; VWAP answers "what did participants actually pay since the anchor."
How do you choose an anchor for anchored VWAP?
Anchor where positioning turned over: a capitulation low, a breakout bar, a liquidation cascade, a funding flip, a major news candle. The AVWAP from such a point tracks the live cost basis of the cohort that entered there, which is what gives the line defenders. An anchor at a quiet, arbitrary bar measures nobody's breakeven and produces a line with no reason to hold.
Read a live one
Everything above is drawn live on the MarketTrace footprint chart. The anchored-VWAP tool computes Σ(price × volume) / Σ(volume) across Binance, Bybit, OKX and Hyperliquid, from any bar you anchor, up to three anchors at once in amber, magenta and cyan. Drop one on a cascade low or a funding flip and watch where that cohort's cost basis actually sits. Free, live, no account.
Sources
- Volume-weighted average price — Wikipedia
- Volume-Weighted Average Price (VWAP): Definition and Calculation — Investopedia
- The Total Cost of Transactions on the NYSE — Berkowitz, Logue & Noser, Journal of Finance (1988)
- Maximum Trading Gains With Anchored VWAP — Brian Shannon (Amazon)
MarketTrace shows aggregated order flow, funding, liquidations and volume profile for BTC, ETH, SOL, BNB, XRP, DOGE, HYPE, ZEC and ENA across Binance, Bybit, OKX and Hyperliquid (liquidations cover Binance, Bybit and OKX). Informational data feed only. Not financial guidance.