Cross-exchange ETH footprint chart for perpetual futures
Sources Binance · Bybit · OKX · HyperliquidAn ETH footprint chart shows bid×ask volume at every price level inside each 1-minute candle. You see who was aggressive, not just where price went. MarketTrace consolidates four ETH perpetual venues (Binance, Bybit, OKX, Hyperliquid) into one chart. Free, no account, no install. Streams live in your browser.
Free, no sign-up. Live in your browser. 30 days of scrollback.
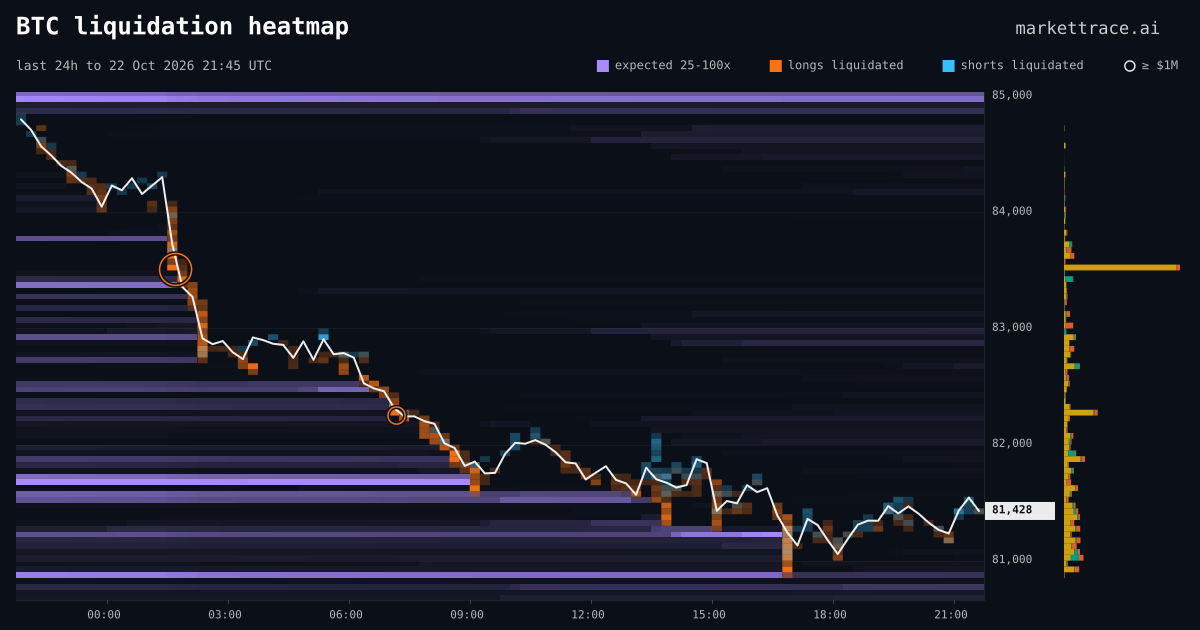
See the liquidation heatmap
Expected liquidation levels from open interest, next to the liquidations that printed on Binance, Bybit and OKX. The 24h map is free.
Try the new order book heatmap
Resting orders at each price over time, from Binance, Bybit, OKX and Hyperliquid in one map. The live 15-minute map is free.
ETH perpetuals right now
ETH perpetuals traded $15.5B over the last 24 hours across Binance, Bybit, OKX and Hyperliquid, with $7.8B in open interest (as of 2026-11-18 20:02 UTC).
| Measure | Binance | Bybit | OKX | Hyperliquid |
|---|---|---|---|---|
| Share of perp volume, 24 h | 50% | 12% | 34% | 4% |
| Share of open interest | 54% | 17% | 16% | 14% |
Row size on this chart: $0.10, 0.0057% of price. Typical 1-minute candle: $1.90 high to low (0.11%), 19 rows, $5.9M traded. History: 30 days.
Busiest minute in the last 24 hours: 16:20 UTC on 2026-11-18. $276M traded, net selling of $93.1M (34% of the candle), and Binance printed 46% of it.
1m is a good default timeframe.
Liquidation markers come from Binance, Bybit and OKX. Hyperliquid, which holds 14% of ETH open interest, has no liquidation feed on MarketTrace.
Typical values are medians of the last 1,440 closed 1-minute candles on MarketTrace's four-venue tape. Updated hourly.
Reading the Ethereum footprint
ETH is the largest crypto perpetual market after BTC. Binance and OKX together printed 84% of ETH perp volume in the same 24 hours. Most heavy cells on this chart come from those two venues. Hyperliquid printed 4% of the volume but holds 14% of the open interest, which means positions there change hands less often. ETH usually moves with BTC minute by minute. If an ETH candle shows aggressive selling and the BTC candle for that minute does not, the selling is specific to ETH. Open the BTC footprint at that time to compare.
What the markers mean
One card per marker. Visual, where you'll see it, what it actually means. Bookmark this section — it's the page you'll come back to.
POC tag
Left edge of a candleYellow triangle marks the price level with the highest volume in that minute. The market's gravity for that minute.
Last price line
Dashed horizontal across all venuesLast traded price on the perp across the four venues. Reference line for where price sits right now versus the heavy zones.
Cyan line
Across the topCumulative delta (ask − bid) across the visible window. Trending up = persistent buying pressure; down = selling.
Delta bar
Base of each candleThin red / green bar with the candle's net delta. Green above zero = net taker-buy. Red below = net taker-sell.
Flip tag
Under a closed barThe bar's delta switched side from the bar before, and both were large: in the top third by size of the last 100 bars. Green = sellers gave way to buyers; red = buyers gave way to sellers. Turn it off in Layers → Delta flip.
Bold outline
On any cellSingle-cell or stacked imbalance ≥ 3:1 on the diagonal. Stacks of these mark absorption or exhaustion zones.
Column total
Above each candleTotal volume traded that minute. Sanity check before you read any cell — context, not signal.
Solid cyan dot
On a cellWall absorbed. A resting order stayed close to peak size while meaningful taker volume hit it. Defended level or hidden refill.
Hollow cyan ring
On a cellWall pulled (spoof). Resting order disappeared with little or no executed volume. Treat as untrustworthy support / resistance.
Thin book
Diagonal slate stripesStripes at the bottom = thin support (air below); at the top = thin resistance (air above). Full column = both. Delta spikes here move price on small capital.
Footprint chart vs trading signals
This is a microscope, not a signal.
The footprint shows who was aggressive at each price as the tape prints. It doesn't predict the next candle. Reading it well takes practice — start with the order-flow primer and the CVD guide if you want context.
Want to know exactly how cells are aggregated across the four venues and how absorption is detected? Read the footprint methodology page. AI agents read the same big trades, wall events and stacked imbalances through our crypto MCP server.
FAQ
Is there a free ETH footprint chart?
Yes. This page streams a live ETH footprint chart built from Binance, Bybit, OKX and Hyperliquid trades. It is free and needs no account.
Which exchange trades the most ETH perpetuals?
Binance. In the 24 hours to 2026-11-18 20:02 UTC it printed 50% of ETH perp volume on MarketTrace's tape, followed by OKX (34%), Bybit (12%) and Hyperliquid (4%).
Which timeframe should I use for the ETH footprint?
A typical 1-minute ETH candle spans 19 rows of $0.10 and trades about $5.9M. 1m is a good default timeframe.
What exchanges are included?
Four ETH perpetual venues: Binance USDⓈ-M, Bybit linear, OKX, Hyperliquid. Each cell shows the cross-venue aggregate. Hover for the per-venue breakdown.
How often does the chart update?
Live cells refresh about four times a second over WebSocket, and the absorption and spoof markers are re-classified every 30 seconds. The 1-minute candles close and lock at the minute mark. You can scroll back 30 days of history.
What does the cyan dot mean?
The solid cyan dot marks an absorbed wall: a resting limit order that stayed near its peak size while taker volume hit it. It marks a defended level. The hollow cyan ring marks a pulled wall (spoof), which disappeared with little or no execution.